Data analysis
練習專案三:資料科學家的工具箱 2
環境設定(Environment Setup)
  建立新環境
  (base) conda create -n data_scientists_toolbox python=3.12

  檢查環境
  (base) conda env list

  進入新建立環境
  (base) conda activate data_scientists_toolbox

  安裝模組
  (data_scientists_toolbox) conda install pandas
  (data_scientists_toolbox) conda install matplotlib
數據準備(Data Preparation)
數據來源(Data Sources)
-
來自 kaggle.com 的競賽
- 2020 Kaggle Machine Learning & Data Science Survey
- 2021 Kaggle Machine Learning & Data Science Survey
- 2022 Kaggle Machine Learning & Data Science Survey
數據結構(Data Structure)
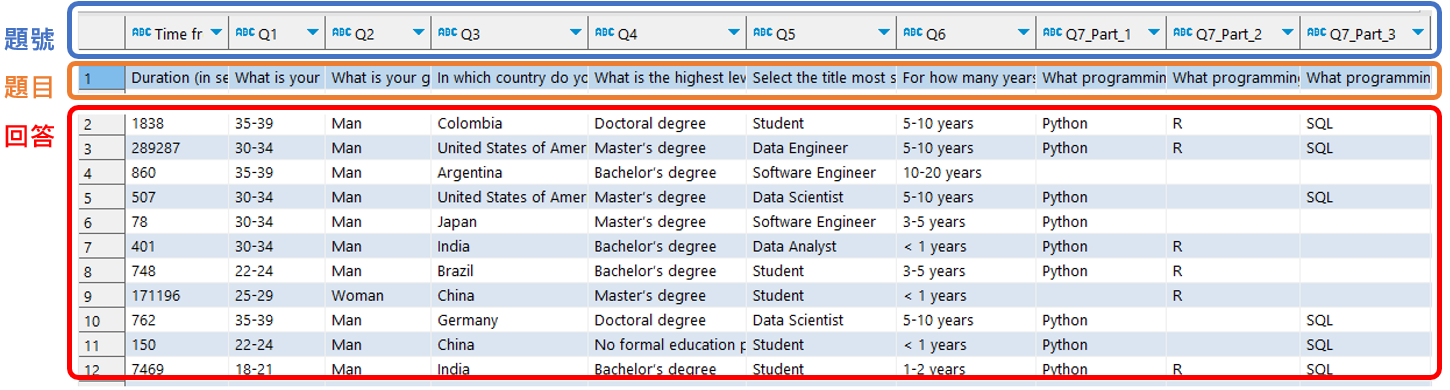
原始資料是以 寬資料表 的形式儲存,每個問題佔一欄。為了方便後續分析,我將資料轉換為 長表格形式,將每筆資料拆解為 「問題」 與 「回覆」 兩個資料表,並移除 空值(Null)。 接著,為了觀察資料在三年間的變化,我們需要先找出三年間的 共通問題,才能進行後續比較分析。
-
原始資料 ( 寬表格 )
-
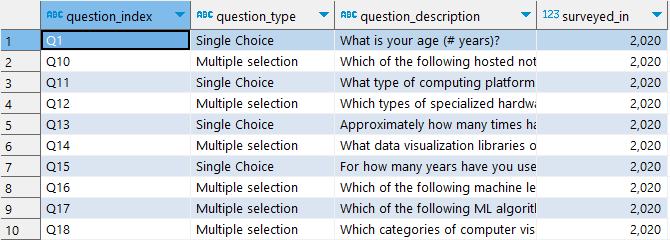
問題 ( 長表格 )
- questions
- question_index
- question_type
- question_description
- surveyed_in
- questions
-
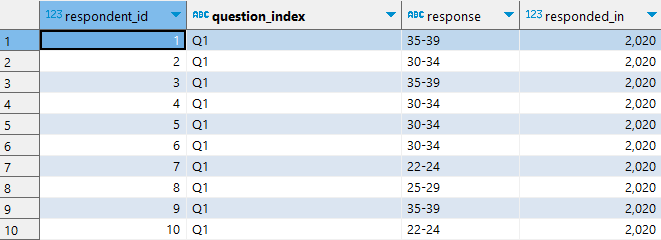
回覆 ( 長表格 )
- responses
- respondent_id
- question_index
- response
- response_in
- responses
寬表格 & 長表格介紹:
當資料結構簡單、只想針對單一題目做統計時,使用寬表就已足夠,不需特別轉換格式。
- 寬表格(Wide Format)
每一列有多個觀測值(即多個題目的回覆),每一欄代表不同的變數(題目)。
適合觀察個體,資料較直觀、方便人工閱讀。
- 長表格 (Long Format)
每一列只包含一個觀測值(回覆),其餘欄位則標示這筆資料來自哪一個變數(題目)。
適合程式設計、SQL查詢、合併多表資料、進行類別比較或視覺化分析。
為什麼要轉長表?
由於三年問卷的欄位命名(如 Q5 與 Q23)略有不同,若採用寬表格查詢會造成程式碼冗長、不易維護。
-
轉換為 長表格 的優點:
- 查詢更簡潔
- 便於合併多年份資料
- 程式碼更具可讀性與擴充性
以這個問題為例:
- Select the title most similar to your current role.
- 2020: Q5
- 2021: Q5
- 2022: Q23
無論是否轉為 長表格 都可以完成分析,但若使用 長表格 ,只需要一半的程式碼即可達成同樣效果。
- 寬表格查詢範例:
select 2020 as surveyed_in,
       Q5 as response,
       count(Q5) as response_count
from kaggle_survey_2020
where Q5 is not NULL and LENGTH(Q5)>1
group by Q5
having response_count > 1
UNION
select 2021 as surveyed_in,
       Q5 as response,
       count(Q5) as response_count
from kaggle_survey_2021
where Q5 is not NULL
group by Q5
having response_count > 1
UNION
select 2022 as surveyed_in,
       Q23 as response,
       count(Q23) as response_count
from kaggle_survey_2022
where Q23 is not NULL
group by Q23
having response_count > 1
order by surveyed_in,response_count desc;
每年欄位都不盡相同(如 Q5 與 Q23),每年欄位都不同,需手動修改欄位與表名,導致維護困難且無法自動化。
- 長表格查詢範例:
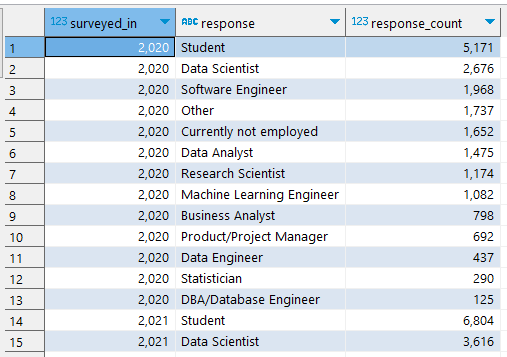
select surveyed_in ,
       response ,
       response_count
from aggregated_responses
where (surveyed_in < 2022 and question_index = 'Q5')
   or (surveyed_in = 2022 and question_index = 'Q23')
order by surveyed_in ,
      response_count desc;
優點一目了然:
- 只需改 WHERE 條件,就能篩選不同題目。
- 可將查詢寫成函式,自動化處理多題目。
- 更方便串接視覺化工具、或應用於批次繪圖腳本中。
查詢解果
兩段程式碼皆可達成相同效果。
總結:
- 寬表格 適合簡單瀏覽與單一題目查詢,但在欄位多樣、時間跨度大時,會造成程式碼繁瑣。
- 長表格 更具彈性與可維護性,無論在查詢、視覺化還是跨表整合時,都能大幅簡化操作。
數據導入(Data Import)
- Step 1:載入與整理原始問卷資料。
-
df_dict
- df_dict[2020, “responses”]
- df_dict[2020, “question_descriptions”]
- df_dict[2021, “responses”]
- df_dict[2021, “question_descriptions”]
- df_dict[2022, “responses”]
- df_dict[2022, “question_descriptions”]
survey_years = [2020, 2021, 2022]
df_dict = dict()
for year in survey_years:
  # read_csv 出現 DtypeWarning,表示 CSV 檔案中 某些欄位的數據類型不一致(mixed types)。
  # 解決方法:low_memory=False:讓 pandas 讀取整個檔案後,再判斷數據類型,而不是只根據部分數據來推測。
  df = pd.read_csv(f"data_scientists_toolbox/data/kaggle_survey_{year}_responses.csv", low_memory=False)

  # 匯入"回覆資料"
  df_dict[year, "responses"] = df.iloc[1:, :]

  # 讀取"題目敘述"
  question_descriptions = df.iloc[0, :].values

  # 題目處裡資料會使用zip,所以事先將資料轉換成一維 (355,)。
  # 如果沒有做這個動作資料會是 (1, 355),在使用zip 會出現錯誤。
  df_dict[year, "question_descriptions"] = question_descriptions
-
-
Step 2:分割題目欄位,提取題號與類型。
  def tidy_data(year):
    # ----------- 題目資料處理--------------
    column_names = df_dict[survey_year, "responses"].columns
    descriptions = df_dict[survey_year, "question_descriptions"]
    question_indexes, question_types, question_descriptions = [], [], []
    for column_name, question_description in zip(column_names, descriptions):

        # 分割 "題號資料",共有 4 種資料型態 ( Q1、Q7_Part_1、Q35_B_Part_1、Q7_1)。
        column_name_split = column_name.split("_")

        # 分割 "題目資料",資料型態 (問題 - Selected Choice -  回覆 )
        question_description_split = question_description.split(" - ")

        # 單選題_處理
        if len(column_name_split) == 1:
            question_index = column_name_split[0]
            question_indexes.append(question_index)
            question_types.append("Single Choice")
            question_descriptions.append(question_description_split[0])

        # 多選題_處理
        else:
            # 處理有大寫字母( Q35_B_Part_1 )資料,只有2020-2021年的資料有大寫字母,所以2022年的資料會直接通過。
            if column_name_split[1] in string.ascii_uppercase:
                question_index = column_name_split[0] + column_name_split[1]
                question_indexes.append(question_index)

            # 處理複選( Q7_Part_1、Q7_1 )資料。
            else:
                question_index = column_name_split[0]
                question_indexes.append(question_index)
            question_types.append("Multiple selection")
            question_descriptions.append(question_description_split[0])

    question_df = pd.DataFrame()
    # 新增 "題號" 資料
    question_df["question_index"] = question_indexes
    # 新增 "單複選" 資料
    question_df["question_type"] = question_types
    # 新增 "問題敘述" 資料
    question_df["question_description"] = question_descriptions
    # 新增 "年份" 資料
    question_df["surveyed_in"] = survey_year
    # 移除重複資料
    question_df = question_df.groupby(["question_index", "question_type", "question_description", "surveyed_in"]).count().reset_index()
-
Step 3:轉換回覆格式,讓資料更適合分析。
  response_df = df_dict[survey_year, "responses"]
  # 將分割好的 "題目資料" 導入,取代 "題目columns"。
  response_df.columns = question_indexes
  response_df_reset_index = response_df.reset_index()
  # 將 "寬資料表" 轉為 "長資料表"
  response_df_melted = pd.melt(response_df_reset_index, id_vars="index", var_name="question_index", value_name="response")
  # 回覆年分
  response_df_melted["responded_in"] = survey_year
  response_df_melted = response_df_melted.rename(columns={"index": "respondent_id"})
  # 清除Null(空)的回覆資料
  response_df_melted = response_df_melted.dropna().reset_index(drop=True)
  return question_df, response_df_melted
回覆資料處理 和 題目資料處理 ,是寫在 def tidy_data(year) 之中 。
- Step 4:儲存為 SQLite 資料庫,準備進行查詢分析。
  question_df = pd.DataFrame()
  response_df = pd.DataFrame()
  for year in survey_years:
      q_df, r_df = tidy_data(year)
      question_df = pd.concat([question_df, q_df], ignore_index=True)
      response_df = pd.concat([response_df, r_df], ignore_index=True)
  # 全部資料
  connection = sqlite3.connect("data_scientists_toolbox/data/kaggle_survey.db")
  question_df.to_sql("questions", con=connection, if_exists="replace", index=False)
  response_df.to_sql("responses", con=connection, if_exists="replace", index=False)
  cur = connection.cursor()
  drop_view_sql = """
  drop view if exists aggregated_responses;
  """
  create_view_sql = """
  create view aggregated_responses as

  select q.surveyed_in,
        q.question_index,
        q.question_type,
        q.question_description,
        r.response,
        count(r.response) as response_count
    from questions q
    join responses r
      on q.surveyed_in = r.responded_in and
        q.question_index = r.question_index
  group by q.surveyed_in,
            q.question_description,
            r.response;
  """
  cur.execute(drop_view_sql)
  cur.execute(create_view_sql)
  connection.close()
- Step 5:找出三年間共通的題目。
select q2022.question_description,
    q2022.question_index as '2022_question_index',
      q2021.question_index as '2021_question_index',
      q2020.question_index as '2020_question_index'
from questions q2022
join questions q2021
  on q2022.question_description = q2021.question_description and
      q2021.surveyed_in = 2021
  join questions q2020
  on q2022.question_description = q2020.question_description and
      q2020.surveyed_in = 2020
where q2022.surveyed_in =2022
group by q2022.question_description
備註(Notes)
- 這次 dict 使用 tuple 作為 key。
[(2020, ‘responses’),
(2020, ‘question_descriptions’),
(2021, ‘responses’),
(2021, ‘question_descriptions’),
(2022, ‘responses’),
(2022, ‘question_descriptions’)]
- Python 字典的 key 必須是 不可變 (immutable) 的對象,例如:int, str, tuple, bool 可以當 key。
- list, dict, set 不能當 key(因為它們是可變的)。
- 元組 (2020, “responses”) 是 不可變 (immutable),所以可以作為 key。